Hey everyone, welcome back to PhoCrypto.com, your go-to spot for straightforward insights on crypto and investing. As someone who’s been deep in the trenches of cryptocurrency trading for years, I love spotting those technical patterns that could signal big moves. Today, we’re diving into Pi Network (PI) – it’s showing some intriguing price action that’s got traders buzzing. Specifically, a double bottom formation at $0.21 that’s holding strong, hinting at a possible relief rally if things break right. Let’s break this down step by step, keeping it simple and actionable.
What Is Happening with Pi Network’s Price Right Now?
Pi Network’s price has been through some ups and downs, but lately, it’s carved out a solid foundation. We’ve seen the price dip to $0.21 not once, but twice – and each time, buyers stepped in with conviction. This creates what’s known as a double bottom pattern in technical analysis, a classic sign that the selling pressure might be easing up. Think of it like a trampoline: the price hits the bottom, bounces, tests it again, and if it holds, it could spring higher.
What’s encouraging here is the volume – that’s the amount of trading activity. During these dips, bullish volume (buying interest) picked up, showing real demand at these lower levels. It’s not just the price stabilizing on its own; active buyers are defending this support zone. As long as Pi stays above $0.21, this setup looks promising for a shift from accumulation (where smart money buys low) to upward momentum.
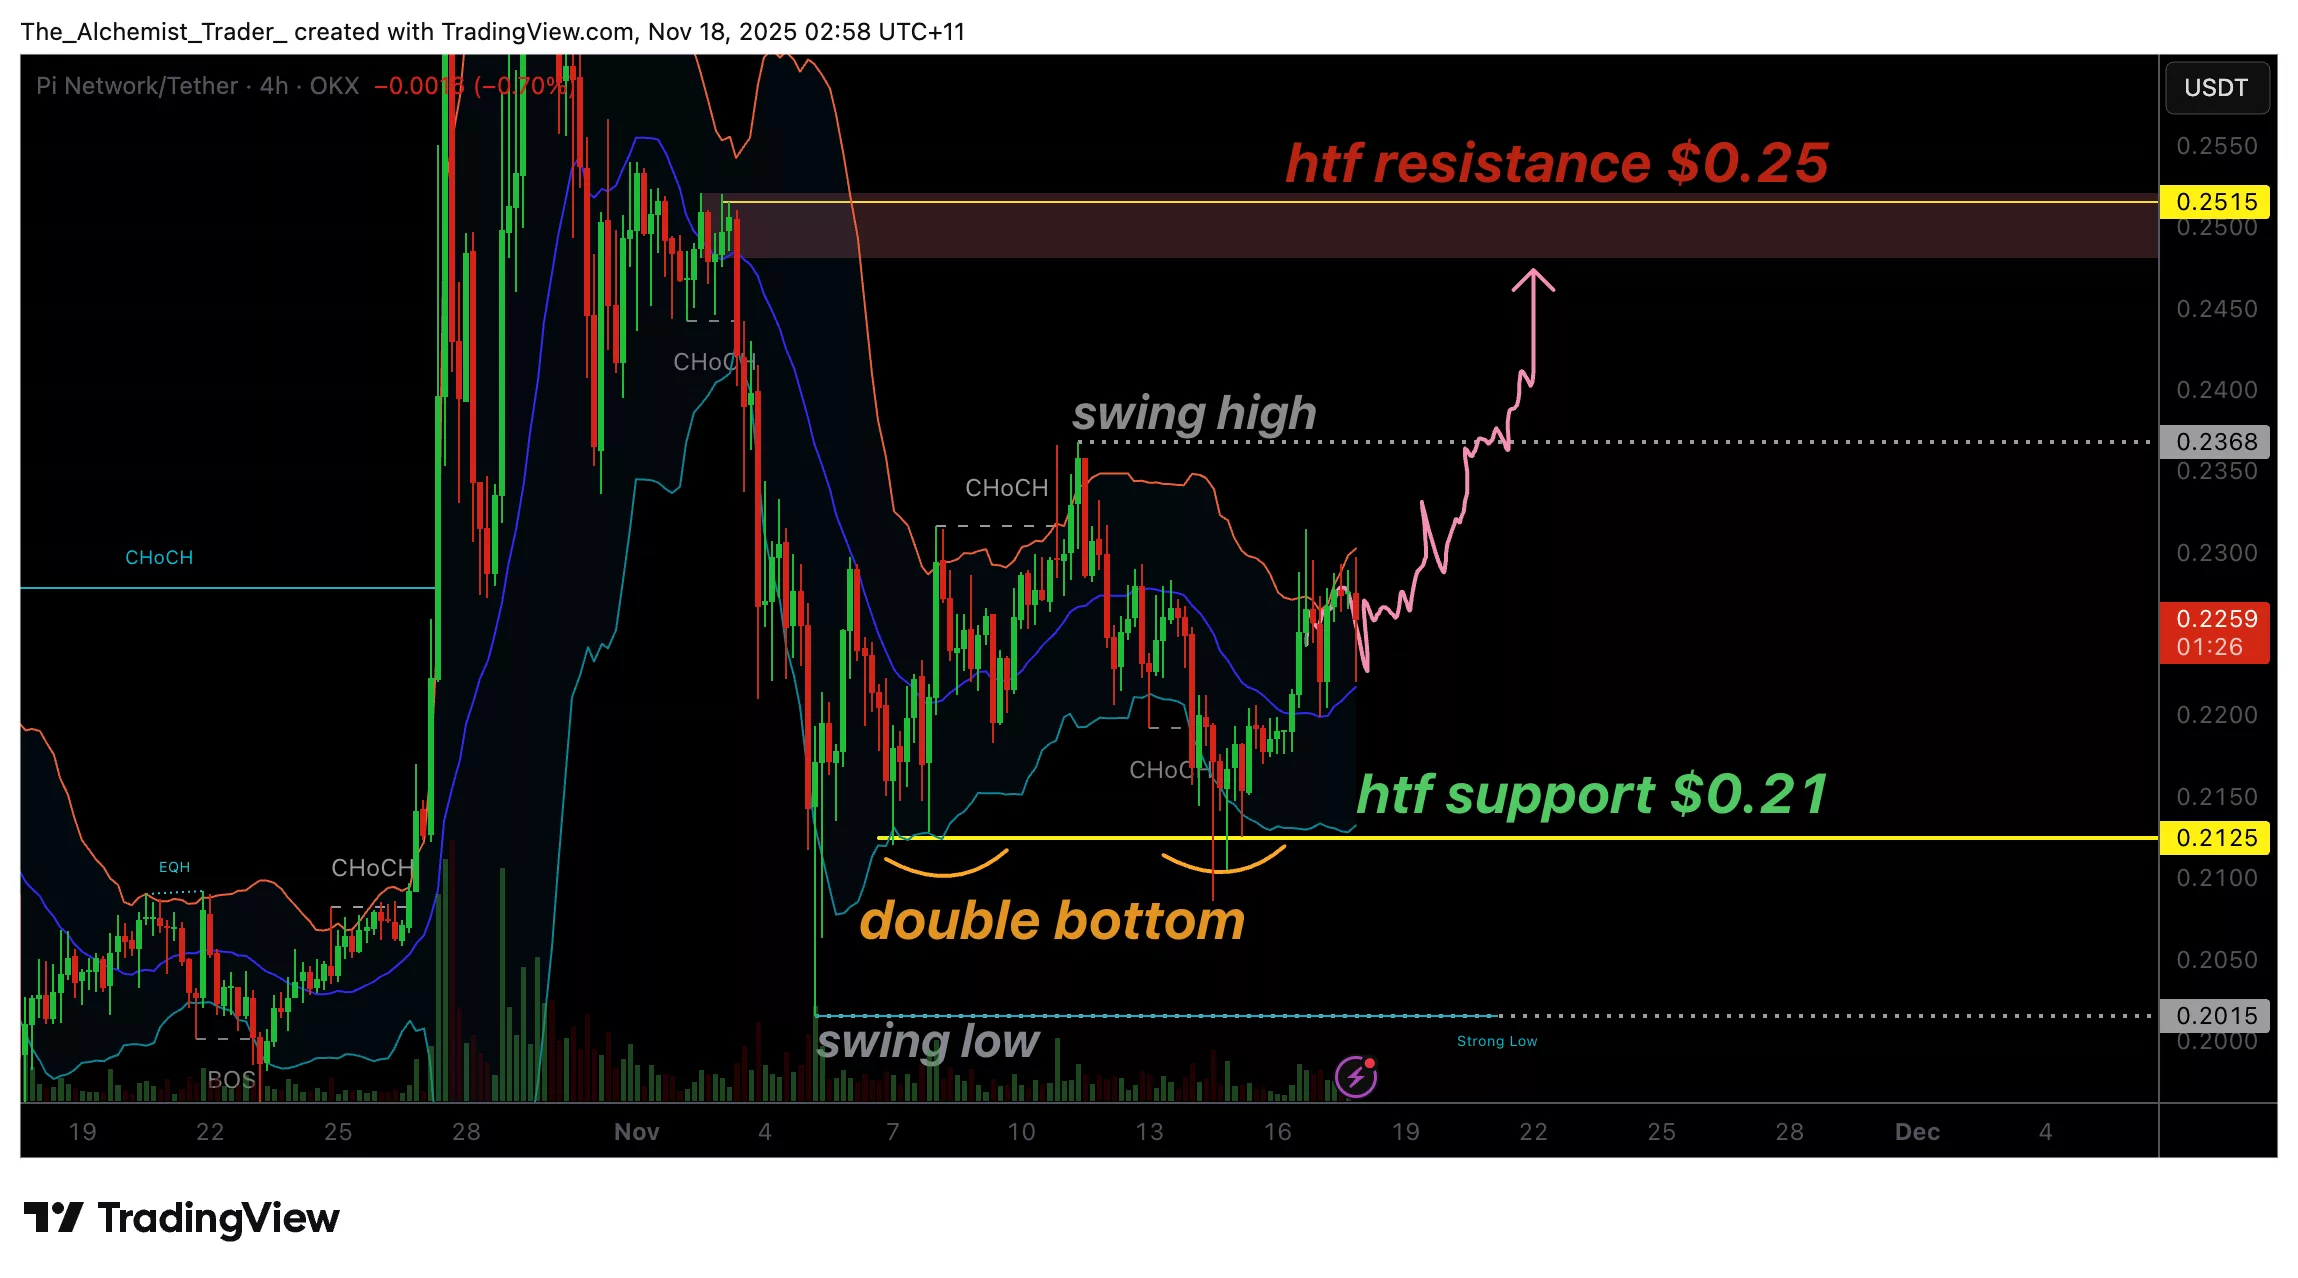
PIUSDT (4H) Chart, Source: TradingVIew
Key Technical Highlights for Pi Network
To make this easy to grasp, here’s a quick rundown of the critical levels and what they mean:
- Strong Support at $0.21: This level has been tested twice and held firm, backed by rising bullish volume. It’s the base of the double bottom, acting as a safety net for the price.
- Next Hurdle: $0.23: This is the swing high from the recent bounce and serves as the “neckline” of the pattern. Breaking above it with conviction could confirm the bullish setup.
- Potential Upside Target: $0.25: If we get that breakout, the price could rally to this zone, which is a psychological round number and a spot where past sellers were active. From $0.21, that’s about a 15-18% gain – a nice relief rally in crypto terms.
These points aren’t just random; they’re based on how the chart is behaving, drawing from patterns we’ve seen in Pi’s history and broader market trends.
A Deeper Look at the Price Action
Zooming in, the price tried to crack below $0.21 a couple of times but got rejected each round. That’s a telltale sign of strength – not from sellers running out of steam, but from buyers jumping in. Volume spiking on those defenses? That’s gold for technical traders. It suggests $0.21 is now a “value area low,” meaning it’s where the market sees real opportunity.
Related: Why Crypto’s Recent Slump Might Be Tied to Struggling Market Makers: Insights from Tom Lee
Right now, the focus is on reclaiming $0.23. If Pi closes a candle (that’s a price bar on the chart) decisively above there, especially with more volume pouring in, it flips the script to bullish. Staying above $0.22 in the meantime would keep the positive vibe going, increasing the odds of rotating up to $0.25. That level isn’t arbitrary; it lines up with an imbalance where supply and demand clashed before, making it a natural target.
I’ve seen this play out in Pi’s past – price flattens out, volume builds, and then boom, a rally follows. It’s not a guarantee, but the parallels are there, and as an investor, these are the setups I watch closely to time entries.
What Could Happen Next for Pi Network?
Looking ahead, the path seems clear-cut:
- Bullish Scenario: If Pi holds above $0.22 and punches through $0.23 with solid volume, the double bottom is confirmed. That opens the door to $0.25, giving us that relief rally and some breathing room for holders.
- Bearish Risk: On the flip side, if it slips below $0.21, the pattern breaks down. That could expose lower prices and more downside pressure, so keep an eye on that support.
In the volatile world of crypto, nothing’s set in stone, but this structure gives us a roadmap. I’m optimistic based on the volume and history, but always trade with stops and manage your risk – that’s investing 101.
Pi Network is at an interesting crossroads with this double bottom, and if the bulls take control, we could see some exciting upside. Whether you’re a long-term holder or a short-term trader, patterns like this are worth monitoring. If you’ve got questions or your own takes on Pi, drop them in the comments below – I love hearing from the community. Stay tuned to PhoCrypto.com for more updates, and remember, invest smart and stay informed. What’s your prediction for Pi’s next move? Let’s discuss!